
How safe are we against COVID-19 in air conditioned buildings?
By Eng. (Dr.) R M P S Bandara, Eng. (Dr.) W C D K Fernando and Eng. (Prof.) R A Attalage
Background
According to the World Health Organization, nearly 225 million persons have been infected and 4.6 million have died due to the global COVID-19 pandemic by the middle of September 2021. COVID-19 is transmitted among humans through respiratory particles and fomites. Respiratory particles are categorized as droplets and aerosols. Particles whose aerodynamic diameter is less than 5 μm are known as aerosols. Through studies conducted recently, it is found that aerosols play a major role in transmitting COVID-19 among humans. When a COVID-19 infected patient coughs, sneezes or exhales, substantial number of droplets are dispersed to the surrounding environment. Heavy virus-laden droplets tend to fall on nearby surfaces and some get converted to aerosols and eventually become airborne. In recent times it is reported that a large number of people have been infected with COVID-19 in confined spaces such as offices and living areas in the built environment. The risk of infection becomes very high when the virus-laden aerosol particles get trapped in the supply air stream that would facilitate the dispersion of the virus throughout the building. In this type of scenario, adhering to “social distancing” is inadequate and less effective as the aerosols have the potential to travel with the assistance of the indoor air flow and could infect occupants who are placed at significant distances from the infected person. Studies reveal that environmental factors such as air temperature, humidity, solar insolation and ventilation affects the viability of airborne microorganisms. It is observed that aerosol dispersion in the built environment is a complex phenomenon and there is a lack of understanding of their behaviour in different microclimatic conditions. Hence, conducting research in order to obtain a better understanding of this aspect is essential in light of the COVID-19 pandemic.
Building ventilation plays a critical role in mitigating the risk of transmission of COVID-19 indoors, through dilution and disposal of virus-laden particles from occupied spaces. Buildings can be ventilated through natural ventilation, mechanical ventilation or hybrid ventilation. In mechanical ventilation, conditioned air (mechanically cooled) is supplied by a heating, ventilating and air conditioning (HVAC) system. Several types of mechanical ventilation/cooling configurations are used in buildings. Some of them include: displacement flow, mixing flow, cavity flow, piston flow etc. It is revealed that the risk of transmission of airborne diseases such as COVID-19 could increase substantially due to an inappropriate or inadequate ventilation strategy. Research show that airflow patterns in a building are influenced by the location and type of supply diffusers, supply airflow rates, supply air temperature, size and location of return diffusers, location of heat sources and obstructions to airflow. Hence, the ventilation strategy has been recognized as a key aspect that governs the contaminant flow paths in a building, in particular those mechanically cooled.
Analysis of indoor airflow is quite a challenge since the phenomena such as complex geometries, turbulence, flow separation, recirculation and buoyancy etc. have to be dealt with. Three scientific approaches: analytical, numerical and experimental approach can be adopted in this regard. Analytical approach has limited applicability in analyzing complex real flows that take place in the built environment. Although the experimental approach is the most accurate method, it is costly and a considerable time has to be allocated on planning, experimental design and taking measurements. Hence, the most feasible and cost effective strategy is the numerical approach. Computational modelling is considered as one such methodology in the aforesaid category. Computational fluid dynamics (CFD) is a well-developed and a robust tool that can be used for this analysis successfully. CFD is reinforced with complex particle tracking capabilities that enables it to predict airflow and dispersion of contaminants in buildings accurately. This article presents an attempt to model the probable flow trajectories of virus-laden aerosols emitted by a COVID-19 patient in a typical office building, which can be served by four different mechanically-driven ventilation configurations, using the CFD approach.
Methodology
Figure 1 shows the details of the geometrical model of the office building.
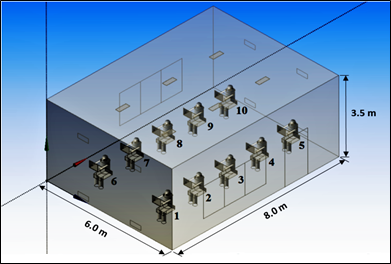 Figure 1: Geometrical model of the office building (Bandara, Fernando & Attalage, 2021)
There are ten seated occupants involved in general office work. Figure 2 shows different ventilation configurations that can supply conditioned air to the building.
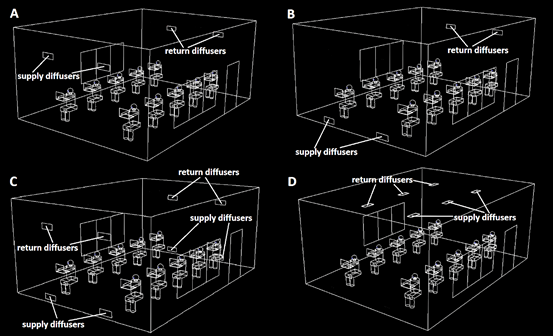 Figure 2: Mechanically-driven ventilation configurations (Bandara, Fernando & Attalage, 2021)
A. Cavity flow ventilation: Supply air enters at the top of the west wall and leaves the room at the top of the east wall
B. Displacement flow ventilation: Supply air enters at the bottom of the west wall and leaves the room at the top of the east wall
C. Mixing flow ventilation (Case 1): Supply air enters at the bottom of both east and west walls and leaves the room at the top of both walls
D. Mixing flow ventilation (Case 2): Supply air enters from three diffusers at the slab level and leaves the room through another three diffusers at the same level
The three-dimensional computational model of the building is shown in Figure 3.
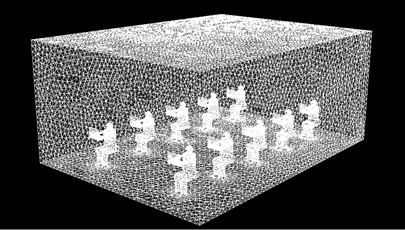 Figure 3: Computational model (Bandara, Fernando & Attalage, 2021)
Among the occupants in the building, either a single or multiple number of individuals may be infected with the COVID-19 virus. Hence, the location(s) of the infected occupants(s) within the occupied space may also differ significantly. Hence, there exists a large number of scenarios for which computational modelling can be performed. However, it is not feasible to analyze all such scenarios in this context. It is evident that if an occupant who directly faces the supply airflow stream or if seated very close to the supply air diffuser is infected with COVID-19, then the impact on diffusing virus-laden aerosols to other healthy occupants in the building is very high. Hence, it is worth considering such an undesirable scenario and to predict the probable trajectories of virus-bearing aerosols within the building, with respect to all ventilation configurations mentioned above. In this context, occupant no. 1 (as shown in Figure 1) is assumed to be infected with COVID-19 and the trajectories of the virus-laden aerosols emitted from him is predicted. This is performed by tracking the aerosol pathlines released from the infected person’s nostril by using the CFD tool.
Simulation Results
Pathlines of the virus-laden aerosols in all four ventilation configurations are shown in Figures 4 to 7.
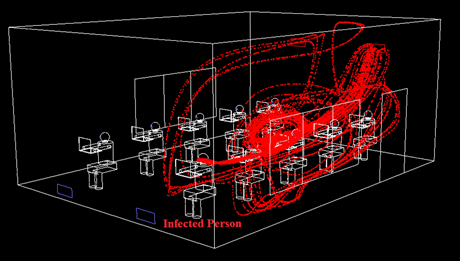
Configuration A: Cavity flow ventilation
As observed in Figure 4, infectious aerosols, after the initial circulation in the longitudinal direction, move upwards and then get entrained back in the supply air stream. However, they travel directly towards the return diffuser and eventually leave the building without getting into contact with any of the occupants.
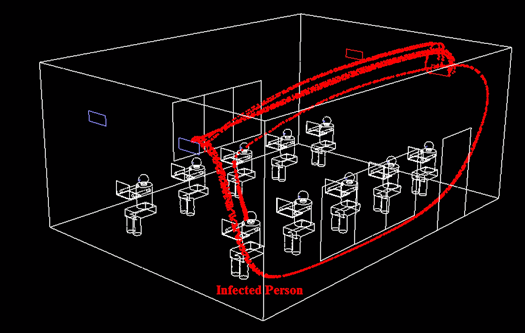 Figure 4: Probable trajectories of infectious aerosols in cavity flow ventilation (Bandara, Fernando & Attalage, 2021)
Configuration B: Displacement flow ventilation
In this scenario (as shown in Figure 5), occupants 2, 3, 4 and 5 (occupants seated in the same line as the infected person) are exposed to the virus-laden particles due to the dispersion of aerosols in the longitudinal direction. However, occupants 6 to 10
 (occupants seated in the other line) do not undergo such an exposure.
Figure 5: Probable trajectories of infectious aerosols in displacement flow ventilation
(Bandara, Fernando & Attalage, 2021)
Configuration C: Mixing flow ventilation (Case 1)
As per Figure 6, virus-bearing aerosols move vertically in the upward direction and then travel towards the return diffuser at the top of the west wall, where they get disposed from the building. In this scenario, aerosols leave the building in a single-pass without getting entrained in the supply air stream. Hence, none of the occupants is exposed to the infectious aerosols in this case.
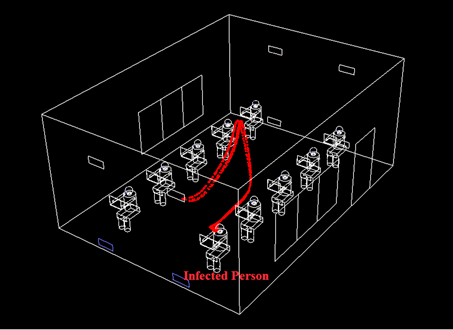 Figure 6: Probable trajectories of infectious aerosols in mixing flow ventilation (Case 1)
(Bandara, Fernando & Attalage, 2021)
Configuration D: Mixing flow ventilation (Case 2)
In this configuration, as supply air is admitted from the top, it travels in the downward direction and creates a highly turbulent region in the vicinity of the infected person. It carries virus-laden aerosols both in the longitudinal and transverse directions, causing them to scatter in a large space in the building as shown in Figure 7. Hence, only occupants 4, 5, 9 and 10 are not exposed to the aerosols in this scenario.
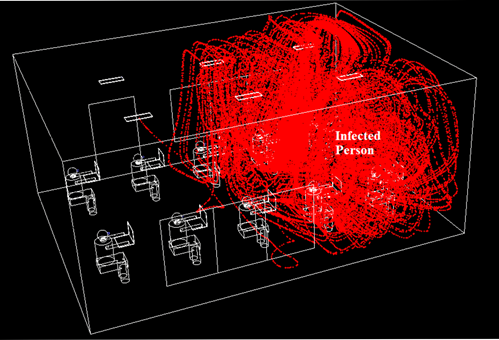 Figure 7: Probable trajectories of infectious aerosols in mixing flow ventilation (Case 2)
(Bandara, Fernando & Attalage, 2021)
Table 1 compares the ventilation configurations in terms of key simulation results.
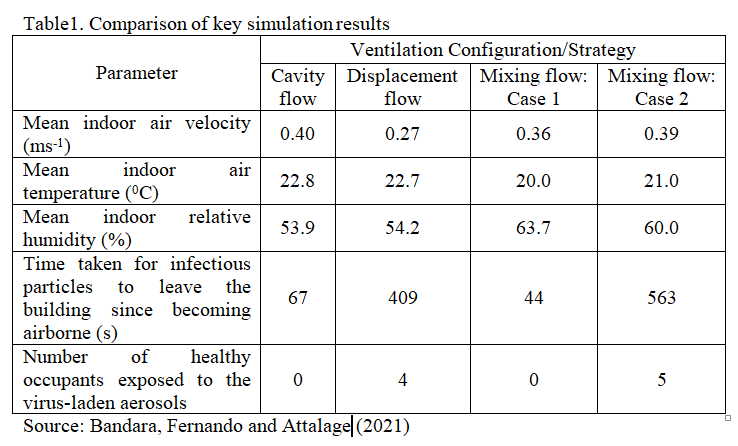
As indicated in Table 1, time taken for the virus-laden aerosols to leave the building is relatively less in mixing flow - case 1 and in cavity flow. Moreover, no occupant exposure is observed in the aforesaid ventilation configurations. In mixing flow – case 2, aerosols take a large time duration to leave the building due to multiple circulations taking place within the building. Therefore, a high risk has been imposed for more than half of the healthy occupants to become infected.
The level of exposure of an occupant is assumed to be a measure of the virus-laden aerosols that penetrate into the breathing zone of that occupant. Table 2 shows the Discrete Phase Model (DPM) concentration at each occupant’s breathing zone in mixing flow - case 2. This configuration is observed as the worst case in terms of the number of possible new infections to occur.
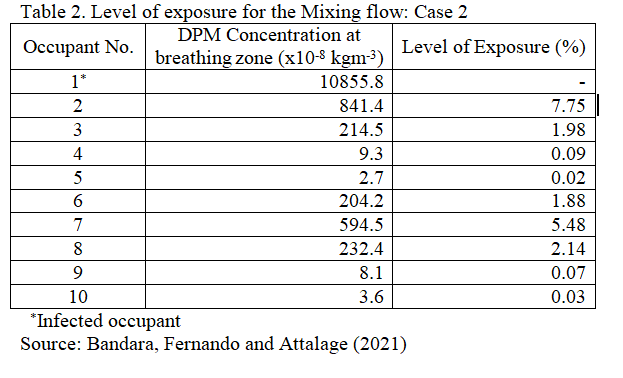
As per Table 2, occupants 2, 3, 6, 7 and 8 are exposed to a higher concentration of virus-laden aerosols that poses a significant risk to become infected. Level of exposure in Table 2 has been presented in terms of the percentage of aerosol mass that penetrates the breathing zone of each healthy occupant with respect to the total mass of aerosols generated and disposed by the infected person’s breathing zone. In this context, occupants 4, 5, 9 and 10 are subjected to negligible exposure.
Conclusion
Placement of supply and exhaust air diffusers, air supply rates, location of the infected person(s), outdoor conditions, construction materials, building geometry, internal heat sources etc. will influence the selection of an appropriate ventilation configuration for a building in order to control the spread of airborne diseases in indoors with conditioned air. The purpose of this article is to elaborate on how different mechanical ventilation configurations affect the spread of airborne diseases such as COVID-19 in the indoor environment. It is expected that this would act as an eye opener for the Engineers to come up with optimal ventilation solutions in order to ensure health and safety of occupants in air conditioned buildings in light of the COVID-19 pandemic.
 Eng. (Dr.) R M P S Bandara
BSc.Eng (Hons.), M.Eng, PhD
Senior Lecturer, Department of Mechanical Engineering, General Sir John Kotelawala Defence University
Associate Member of IESL, Member of SLAAS - Section C, Member of SLAIHEE
 Eng. (Dr.) W C D K Fernando
BSc.Eng (Hons.), M.Eng, PhD ,
Senior Lecturer, Department of Civil Engineering, General Sir John Kotelawala Defence University
Associate Member of IESL, Member of SLAAS - Section C, Member of SLAIHEE
 Eng. (Prof.) R A Attalage
BSc.Eng (Hons.), M.Eng, DEA, PhD
Dean, Faculty of Graduate Studies and Research, Sri Lanka Institute of Information Technology, Professor in Mechanical Engineering, Chartered Engineer, Member of IESL, Member of ASHRAE, Corporate Member of SLEMA, Fellow of Lanka Association of Building Services Engineers (LABSE), Fellow of National Academy of Sciences Sri Lanka, Member of SLAAS - Section C


